Introduction: Why Real-Time Visibility Is Critical in Concrete Production
In concrete manufacturing, delays and inefficiencies can have a domino effect—impacting batching, delivery, project timelines, and profitability. With demand for faster delivery and higher accuracy, plant operators can no longer rely on manual logs or end-of-day reports to monitor performance.
ERP dashboards are now essential tools that give operations teams live insights into every part of the plant: from batching cycles to truck movement. Real-time visibility helps identify bottlenecks, reduce idle time, and drive continuous improvement across the production lifecycle.
The Role of ERP Dashboards in Plant Monitoring
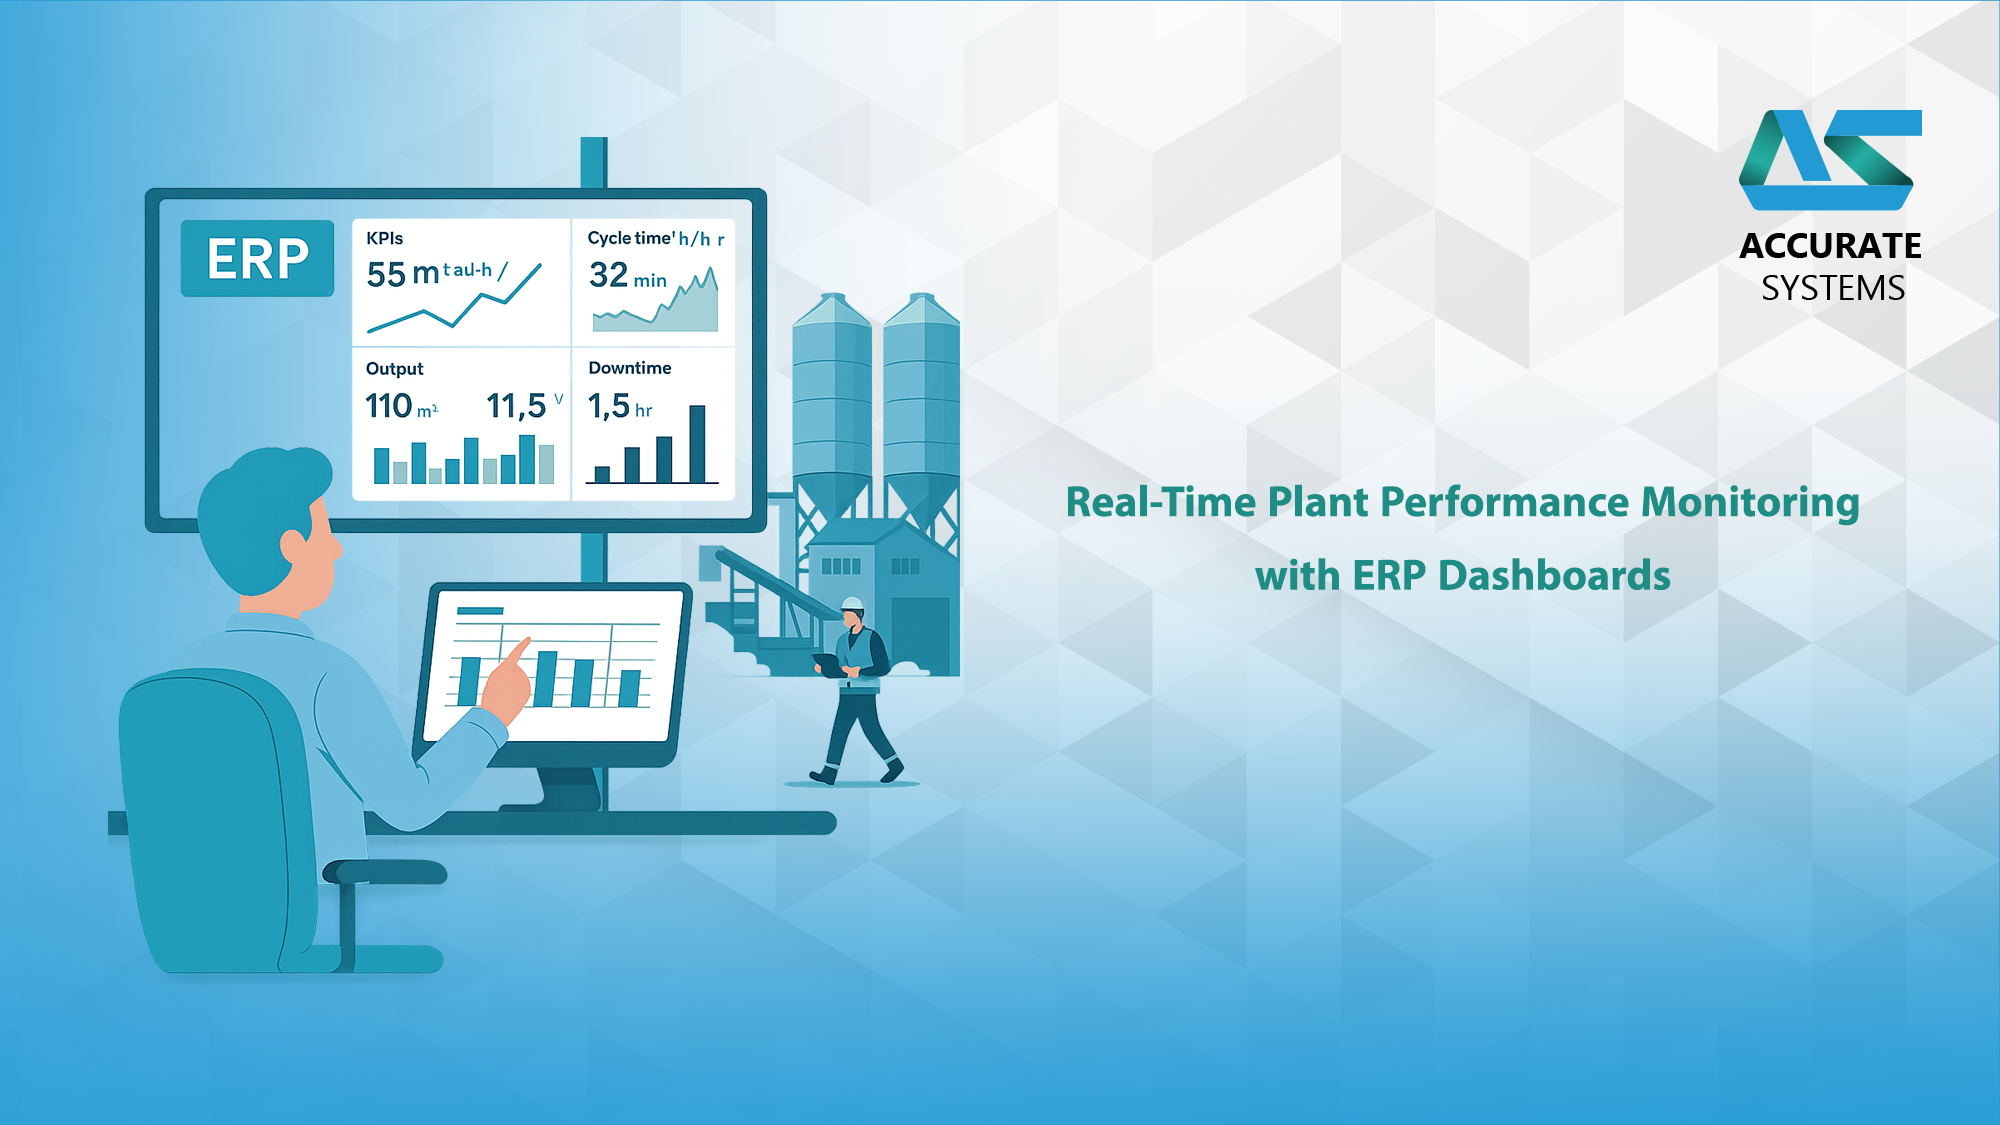
Enterprise Resource Planning (ERP) systems consolidate data from various production sources—mixing equipment, dispatch software, sensors, and mobile devices—into centralized dashboards. These dashboards provide:
- Visual summaries of critical metrics
- Alerts for anomalies or breakdowns
- Historical trends and performance benchmarks
- Drill-downs into specific shifts, orders, or plants
Accessible via desktop or mobile devices, ERP dashboards help plant managers make decisions in real time.
Key KPIs for Plant Performance Monitoring
Monitoring the right key performance indicators (KPIs) ensures that plant managers stay aligned with production goals, quality standards, and delivery expectations.
1. Cycle Time
- Definition: The time taken to complete one batch—from loading materials to dispatch.
- Why it matters: A shorter cycle time means higher throughput and reduced plant bottlenecks.
- Target KPI: Varies by plant size and equipment, but often < 6 minutes per cycle.
2. Downtime Tracking
- Definition: Amount of time equipment is idle due to breakdowns, maintenance, or delays.
- Why it matters: High downtime indicates issues with equipment, maintenance planning, or scheduling.
- Dashboard Feature: Alerts for unplanned stops; logs of downtime reasons.
3. Cubic Meters per Hour (Output Rate)
- Definition: Total concrete produced per hour across shifts.
- Why it matters: Measures the productivity of the plant and helps forecast production capacity.
- Comparison: Benchmarks against plant’s optimal capacity.
4. Truck Turnaround Time
- Definition: Time taken from truck entry, batching, loading, and dispatch to return.
- Why it matters: Impacts delivery efficiency, client satisfaction, and fuel usage.
- Breakdown: Analyze by time at plant, loading time, and return delays.
5. Batch Accuracy
- Definition: Deviation between planned and actual weight of ingredients.
- Why it matters: Ensures quality and reduces rework or rejections.
- KPI: Deviation should be within defined tolerances (<2%).
6. Order Fulfillment Rate
- Definition: Percentage of orders completed on time and in full.
- Why it matters: Indicates customer satisfaction and operational reliability.
7. Fuel and Energy Consumption
- Definition: Liters or kWh used per cubic meter of concrete.
- Why it matters: Tracks environmental footprint and cost efficiency.
Real-Time Monitoring Features in ERP Dashboards
ERP dashboards aren’t just reports—they’re live systems connected to field data.
Live Monitoring Tools:
- Plant Performance Dashboard: View live output, downtime, cycle times.
- Fleet Movement Tracker: See truck location, route, and estimated return time.
- Shift Performance Overview: Compare KPIs across different operator shifts.
- Alert System: Automated warnings for delays, overloads, or missed KPIs.
Mobile Accessibility:
- Monitor dashboards remotely from smartphones or tablets.
- Field supervisors can check status and escalate issues instantly.
Using Performance Data for Continuous Improvement
ERP dashboards also support historical analysis and operational reviews.
Analysis Tools:
- Trend Reports: Visualize performance over days, weeks, or months.
- KPI Comparisons: Benchmark plants, operators, or shift teams.
- Root Cause Analysis: Investigate repeated downtime or quality deviations.
- Shift Briefings: Use previous shift’s data for handovers and planning.
Benefits:
- Build a culture of accountability
- Reward high-performing teams based on data
- Align daily operations with strategic targets
Conclusion: Real-Time Dashboards Drive Smart Concrete Operations
In the concrete industry, success depends on how well you can monitor and respond to fast-moving operations. ERP dashboards empower concrete producers with real-time insights into batching, delivery, plant uptime, and fleet performance.
With the right KPIs and a live dashboard in hand, you can:
- Detect issues before they cause downtime
- Optimize cycle times and truck utilization
- Deliver concrete on time, every time
#ERPNext #ConcreteERP #RealTimeMonitoring #PlantDashboards #BatchingKPIs #FleetEfficiency #SmartConstruction #ReadyMixConcrete #OperationalExcellence